

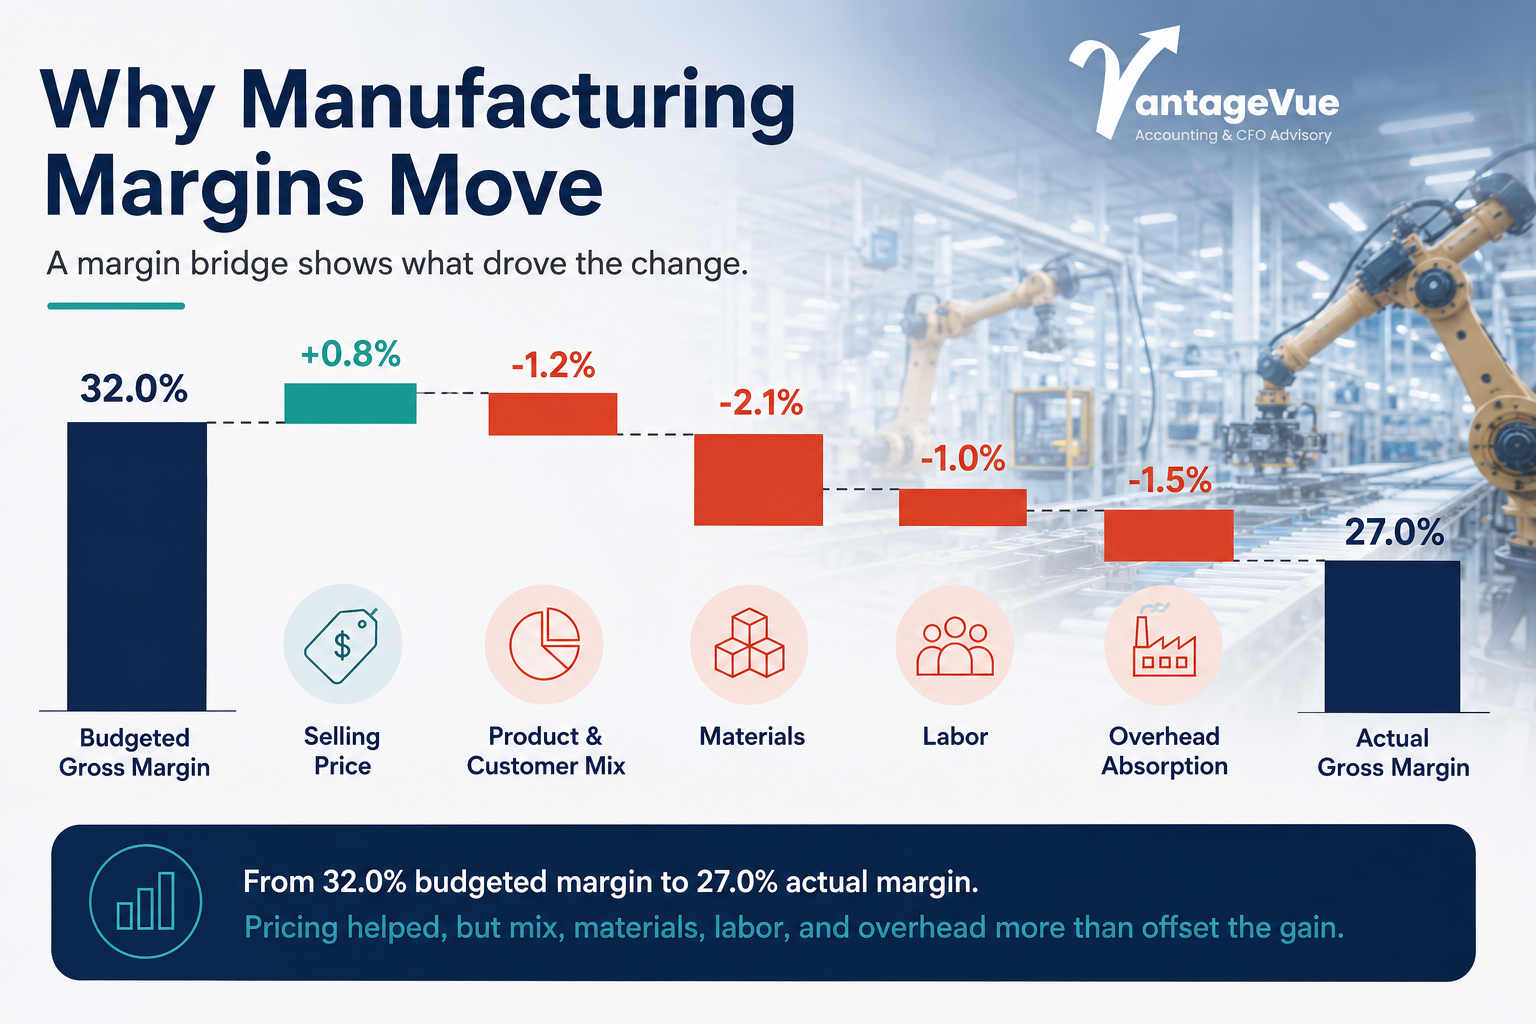
Revenue came in close to plan, but gross margin fell from a budgeted 32% to 27%.
That result raises an immediate question: what changed?
The business may have realized less pricing than expected. Lower-margin products may have made up more of the month’s sales. Supplier costs, scrap, overtime, or rework may have increased. Production volume may also have been too low to absorb fixed manufacturing costs efficiently.
The income statement shows where margin landed. It rarely explains how the business got there.
A manufacturing margin analysis separates the movement into price, mix, materials, labor, and overhead. That gives leadership a better basis for action than responding to every margin decline with the same cost-cutting plan.
Start With a Manufacturing Margin Bridge
A budget comparison identifies the size of the gap. A manufacturing margin bridge explains what created it.
Consider a manufacturer that budgeted a 32% gross margin but finished the month at 27%.
Budgeted margin: 32.0%
Price: +0.8 points → Mix: −1.2 points → Materials: −2.1 points → Labor: −1.0 point → Overhead: −1.5 points
Actual margin: 27.0%
This is a simplified illustration. Many manufacturers calculate each effect in dollars first and then translate it into its contribution to the margin percentage.
The bridge changes the conversation. Pricing helped, but the improvement was more than offset by unfavorable mix, material costs, labor pressure, and weaker overhead absorption.
Each driver tells a different operational story. Price begins with commercial decisions. Mix reflects what the business sold. Materials and labor show what production consumed. Overhead indicates how effectively the plant used its capacity.
Price and Mix: What Did the Company Sell, and at What Return?
Price added 0.8 points in the example, but even a favorable result needs context.
Pricing analysis should focus on what customers actually paid for comparable products—not simply the amount shown on a standard price list.
A manufacturer may announce an increase but realize less than expected because of discounts, contract timing, rebates, freight allowances, or customer-specific exceptions. Quotes may also rely on outdated assumptions about labor, materials, or freight.
The word “comparable” matters because average selling price can be distorted by product mix.
Suppose the business expected most revenue to come from a standard product with long production runs. Instead, more sales came from custom orders requiring additional setup, engineering support, and shorter runs.
Revenue may remain close to budget while margin declines.
That does not automatically make the custom work unattractive. A lower-margin order may fill unused capacity, support an important customer, or create future opportunities. The same order may be less attractive when production is constrained and more profitable work is being delayed.
Leadership needs to understand whether expected price increases were realized, which products and customers drove the mix change, and whether lower-margin work provided enough contribution to justify the operational demand.
A pricing problem may require stronger quoting or discount controls. A mix problem may require changes to sales priorities, incentives, or production allocation.
Materials and Labor: What Did Production Consume?
Materials created the largest unfavorable movement in the example, reducing margin by 2.1 points.
The first step is to separate what the company paid from what production used.
A supplier increase, expedited freight, and higher scrap may all raise material cost, but they have different causes and owners.
Purchase-price pressure may come from supplier increases, tariffs, freight, or purchases made outside normal agreements. The response may involve sourcing, negotiations, customer surcharges, or updated quote assumptions.
Material-usage pressure comes from consuming more than expected for the output produced. Scrap, poor yield, rework, engineering changes, or outdated bills of material may be responsible.
Suppose half of the material impact came from supplier pricing and the rest from scrap on a new product. Purchasing may need to address the first issue. Operations, engineering, and quality may need to investigate the second.
Labor requires a similar distinction.
Labor cost can rise because hourly rates increased or because production required more hours than planned. Overtime and wage changes affect the rate. Downtime, rework, shorter runs, and scheduling problems affect efficiency.
An unfavorable labor variance is not automatically an employee-performance problem. Employees may have been waiting for materials, maintenance, approvals, or revised specifications. The month’s product mix may also have required more labor than the original standards assumed.
Before reducing staffing or pushing teams to move faster, leadership should understand why the extra hours were needed.
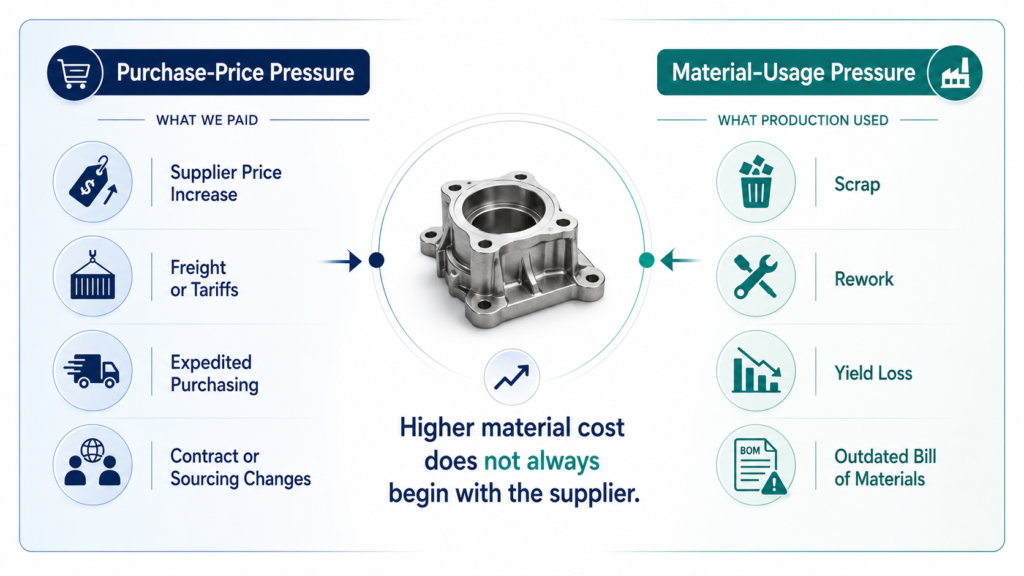
Separating material price from material usage helps leadership assign the right owner and response.
Overhead: Did the Plant Produce Enough?
Overhead absorption reduced margin by 1.5 points in the example.
This can happen even when overhead spending remains close to budget.
Manufacturing overhead may include facility expenses, depreciation, maintenance, production supervision, utilities, indirect labor, and quality support. Many of these costs remain relatively fixed over the short term.
Assume the plant expected to produce 100,000 units but completed only 75,000. Rent, depreciation, and much of the supervision cost remained in place, but those expenses were spread across fewer units.
The cost per unit increased even though the plant did not materially overspend.
Leadership then needs to understand why output was below plan. Demand may have slowed. Equipment may have been unavailable. Materials may have arrived late. Production may also have been reduced intentionally to control inventory.
These explanations require different responses.
A temporary interruption may not justify cutting fixed resources. Persistent unused capacity, however, may require a review of demand assumptions, production scheduling, the facility footprint, or the fixed-cost structure.
Overhead analysis should answer two separate questions:
- Did the company spend more than expected?
- Did it produce enough volume to absorb the costs already in place?
Without that distinction, management may reduce spending that was not causing the margin problem.
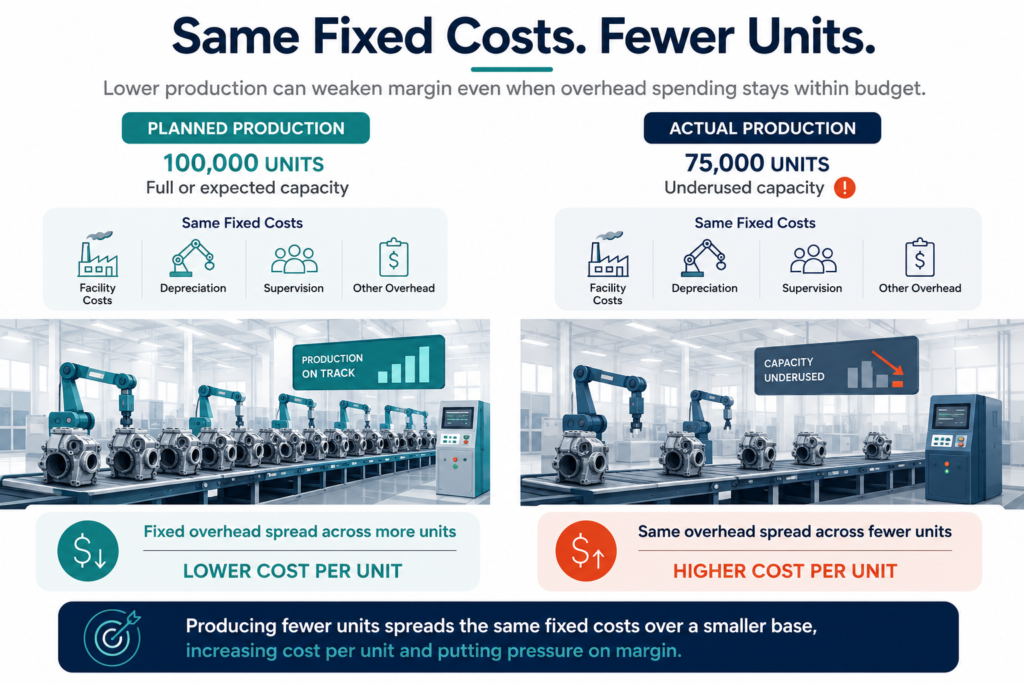
Overhead absorption weakens when fixed manufacturing costs are spread across fewer units.
Match the Response to the Driver
A five-point margin miss should not lead automatically to one broad cost-reduction program.
Use the driver to guide the response:
- Price: Review contracts, discounts, surcharges, and quoting assumptions.
- Mix: Identify which products, customers, or order types changed and whether the work justified its operational demand.
- Materials: Separate supplier and freight increases from scrap, yield, and usage problems.
- Labor: Determine whether rates, overtime, downtime, rework, or production complexity drove the variance.
- Overhead: Separate actual overspending from underused capacity and weaker absorption.
In the example, pricing was favorable. The larger problems were the combination of work sold, higher material costs and scrap, labor inefficiency, and production below the level assumed in the overhead plan.
A broad cost-cutting response would miss most of that story.
The stronger response is more specific: review the custom work affecting mix, address supplier costs, investigate scrap, reduce avoidable overtime, and understand why plant output fell below plan.
Make Margin Analysis Part of the Monthly Review
A margin bridge should become part of the monthly operating review—not an analysis prepared only after performance has already deteriorated.
The review should show:
- Actual margin compared with budget
- Movement caused by price, mix, materials, labor, and overhead
- The operational explanation behind significant variances
- Assigned actions and owners
- Changes needed in the forecast
Finance can calculate the movement, but it cannot explain every cause alone.
Sales should address pricing and customer mix. Purchasing should explain supplier and freight changes. Operations should address labor hours, downtime, scrap, and production output. Engineering and quality may need to explain design changes, yield problems, or rework.
The review should end with decisions, owners, and target dates. Without that step, the bridge remains an accounting explanation rather than a management tool.
Margin Reporting Should Lead to Better Decisions
A gross-margin percentage tells leadership where the business landed. It does not explain how it got there.
Separating price, mix, materials, labor, and overhead shows whether the company is dealing with a commercial issue, a sourcing problem, an efficiency gap, or a capacity challenge.
Those distinctions matter.
A pricing issue may require better quoting or contract terms. Higher material usage may point to scrap or outdated standards. Labor variance may begin with downtime rather than staffing. Weak overhead absorption may reflect lower production volume even when spending remains within budget.
The purpose of a manufacturing margin bridge is not to create another finance schedule. It is to help sales, operations, purchasing, and leadership agree on what changed, who owns the response, and which assumptions need to change in the forecast.
VantageVue Advisory helps manufacturers improve profitability reporting, explain margin movement, and connect financial results with operating decisions.
To discuss manufacturing finance and profitability support:
(612) 200-2651