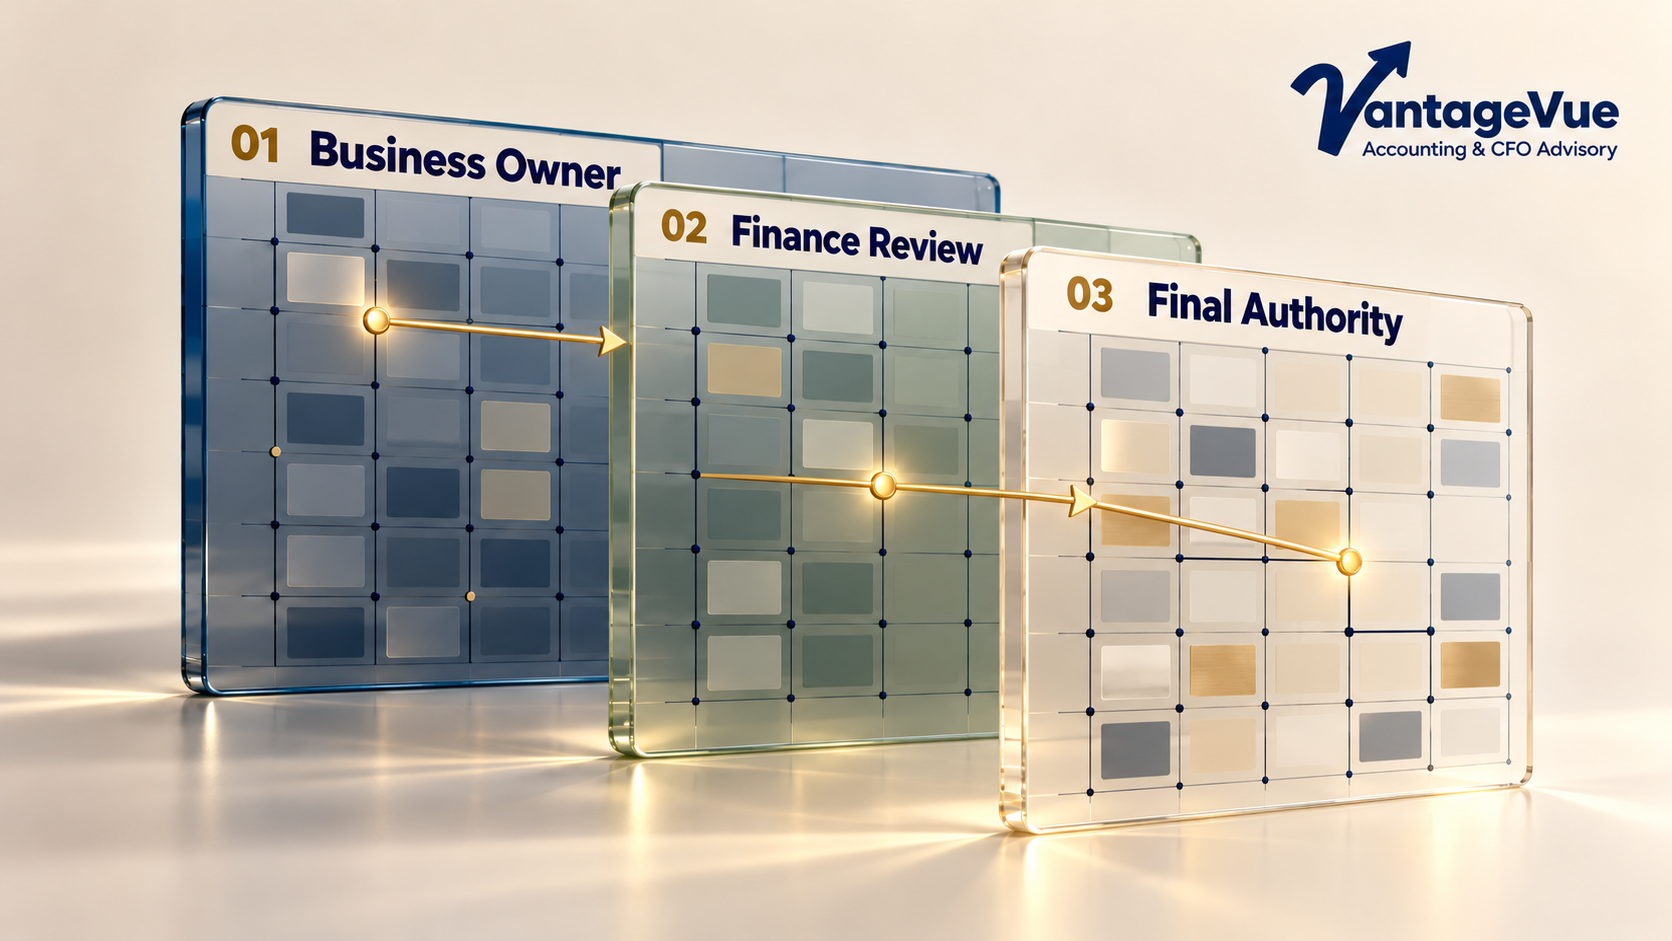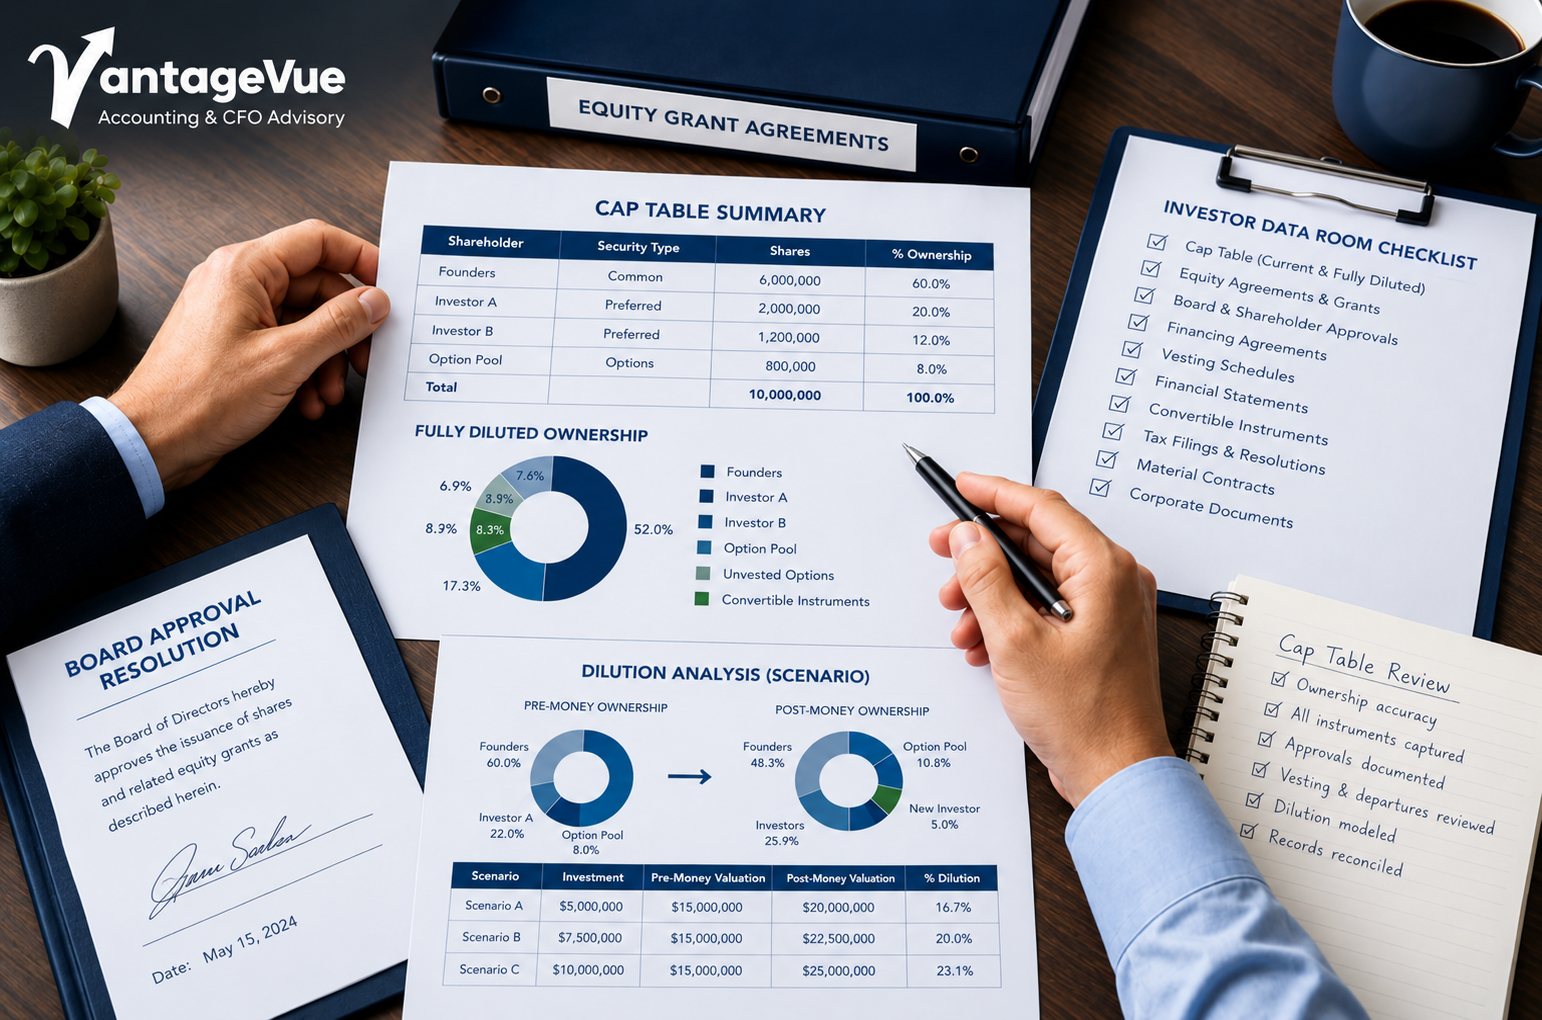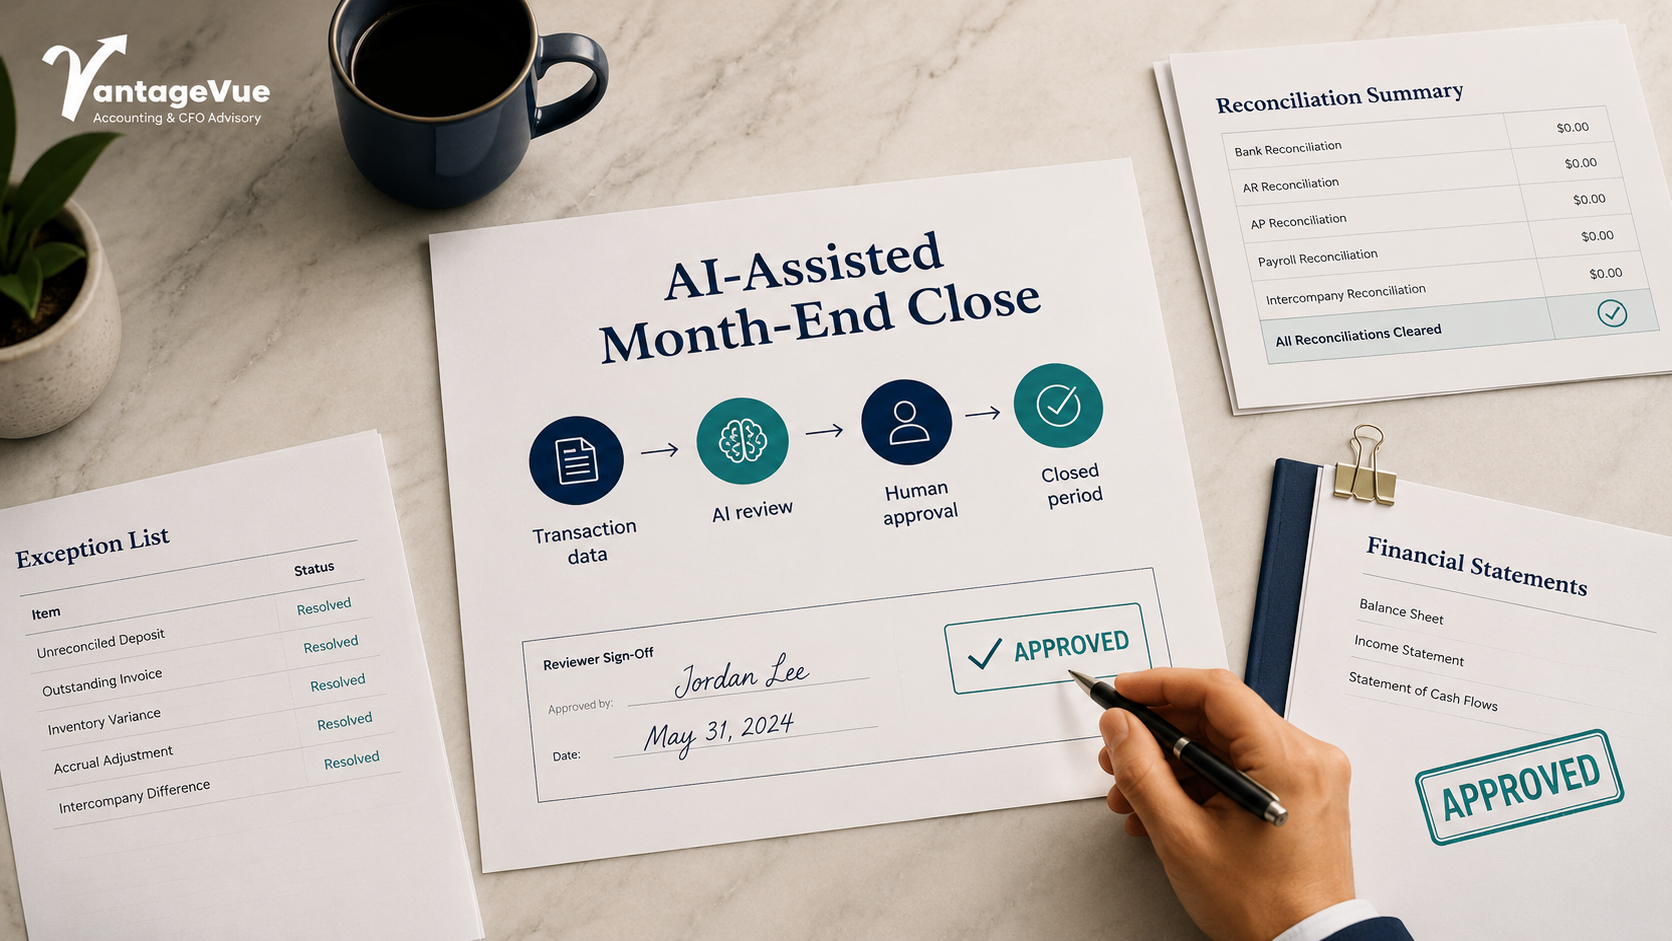


As businesses grow, leadership often has access to more data than ever before.
There may be accounting reports, spreadsheets, dashboards, CRM data, payroll reports, sales updates, project trackers, and operational summaries. On the surface, that can look like visibility.
But more information does not always create better decisions.
Many leadership teams still struggle to answer the questions that matter most:
- What is changing in business?
- Where is pressure building?
- Which numbers deserve attention?
- What decision needs to happen next?
That is where KPI dashboards can either help or hurt.
A useful dashboard does more than display metrics. It helps leadership understand performance, identify issues earlier, and focus on the decisions that matter most.
For founder-led companies and growing businesses, the goal is not to create a dashboard filled with every available number. The goal is to build a practical decision-making tool.
A good KPI dashboard should help leadership move from reviewing information to acting on insight.
More Data Does Not Always Mean Better Visibility
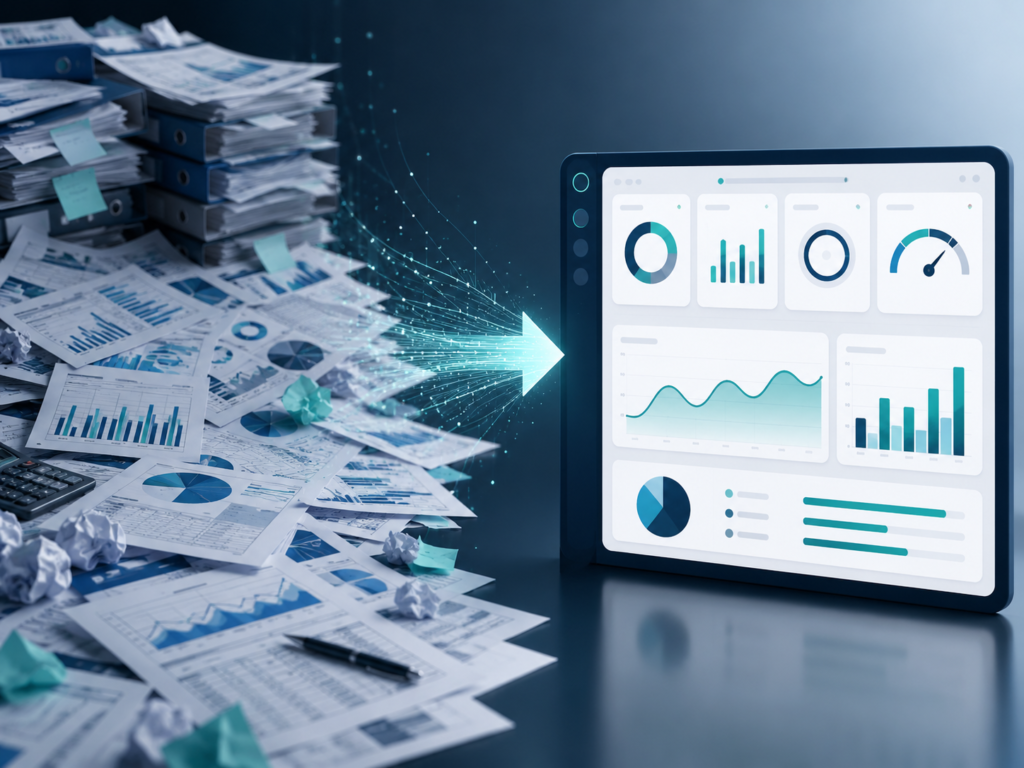
Many businesses already have access to financial and operational data.
The issue is often not a lack of information. It is that the information is scattered, delayed, too detailed, or not organized around leadership decisions.
A dashboard may show revenue, expenses, cash, margins, receivables, project activity, sales pipeline, utilization, and dozens of other metrics. But if leadership cannot quickly understand what is improving, what is weakening, and what needs attention, the dashboard is not doing its job.
Too much data can create noise.
When every number is treated equally important, leadership has to spend more time interpreting the dashboard than using it. Important signals get buried. Trends may be missed. Decisions may be delayed while teams try to determine which numbers matter most.
Strong dashboards do not show everything.
They show what matters.
The best KPI dashboards help leadership see the few indicators connected to business performance, cash flow, profitability, capacity, and risk. They create focus instead of clutter.
Start With the Decisions Leadership Needs to Make
A useful KPI dashboard should not begin with the question, “What can we measure?”
It should begin with the question, “What decisions does leadership need to make?”
That distinction matters.
- If the business is deciding whether to hire, the dashboard should help leadership understand capacity, payroll impact, cash flow, revenue visibility, and margin pressure.
- If the business is deciding whether to expand, the dashboard should show whether demand, staffing, systems, working capital, and profitability can support that expansion.
- If the business is managing cash pressure, the dashboard should highlight collections, payables, payroll timing, cash runway, and upcoming commitments.
- If the business is evaluating profitability, the dashboard should show gross margin, service-line margin, product margin, project profitability, pricing trends, and cost movement.
The right KPIs depend on the decisions in front of the business.
A dashboard that does not support decisions becomes a reporting exercise. A dashboard built around leadership questions becomes a management tool.
Choose KPIs That Match the Business Model
Not every company needs the same dashboard.
A founder-led professional services firm needs different visibility than a manufacturing business. A staffing company needs different KPIs than a SaaS company. A growing advisory firm needs different reporting than an e-commerce business.
The dashboard should reflect how the company makes money, delivers work, manages cash, and uses resources.
- For a professional services firm, important KPIs may include project profitability, utilization, billing realization, client profitability, revenue by service line, collections timing, and capacity by team or role.
- For a staffing or recruiting business, leadership may need visibility into gross margin, payroll timing, billing cycles, recruiter productivity, fill rates, customer concentration, receivables, and collections.
- For a manufacturing or distribution business, the dashboard may need to focus on inventory levels, standard costs, gross margin by product, labor and overhead assumptions, purchasing trends, working capital, and capacity.
- For a SaaS or technology company, leadership may need to track recurring revenue, cash runway, churn, customer acquisition cost, burn rate, expansion revenue, product investment, and hiring plans.
- For a founder-led company, the most useful KPIs may include cash flow, revenue quality, margin by service line, working capital, operating leverage, capacity, and forecast visibility.
The point is not to build the largest dashboard.
The point is to identify the few metrics that help leadership understand whether the business is healthy, where pressure is building, and what decisions need attention.
Separate Reporting Metrics from Decision Metrics
Some metrics are useful for reporting. Others are useful for decision-making.
Both matter, but they are not the same.
Reporting metrics summarize what happened. They may include revenue, expenses, profit, cash balance, and month-end results. These numbers are important, but they often look backward.
Decision metrics help leadership understand what is changing and what may happen next. These may include margin trends, cash conversion, forecast variance, utilization, backlog, sales pipeline quality, receivables aging, working capital pressure, and capacity constraints.
A monthly profit and loss statement may show that revenue increased. But leadership may still need to know whether that revenue came from profitable work, whether collections are slowing, whether costs are rising, or whether the team has enough capacity to keep delivering at the same level.
That is the difference between reporting and decision support.
A leadership dashboard should connect the two.
It should show what happened, why it happened, and what needs attention next.
Make the Dashboard Easy to Act On
A dashboard does not need to be complicated to be useful.
In fact, the most useful dashboards are often the clearest ones.
Leadership should be able to review the dashboard and quickly understand:
- What has changed since the last review?
- Which metrics are on track?
- Which metrics are off track?
- Where is pressure building?
- What decision or follow-up is needed?
the dashboard requires too much explanation, it may be too complex. If it includes too many metrics, it may create more confusion than clarity. If it is not reviewed consistently, it may become another report that gets produced but not used.
Good dashboard design is not only about visuals.
It is also about structure.
The dashboard should organize information in a way that reflects how leadership thinks about the business. Financial and operational metrics should be connected where appropriate. Cash flow should not be separated from growth decisions. Margin should not be separated from pricing, delivery, or capacity. Revenue should not be viewed without understanding the cost and cash required to support it.
The dashboard should make business performance easier to understand, not harder.
Keep the Dashboard Connected to Forecasting
KPI dashboards become more useful when they connect historical performance to forward-looking planning.
A dashboard may show what happened last month. A forecast helps leadership understand what may happen next.
Together, they create a stronger management rhythm.
- If utilization is declining, the forecast can show how that may affect revenue and margin.
- If receivables are stretching, the cash forecast can show when pressure may appear.
- If payroll is increasing, the forecast can show whether the business has enough revenue visibility to support the added cost.
This is where KPI dashboards become more than reporting tools.
They become early-warning systems.
They help leadership see whether current performance is supporting the plan, whether assumptions need to change, and whether decisions need to be made sooner.
A strong dashboard should not sit separately from budgeting and forecasting. It should help leadership compare actual performance to expectations and adjust before small issues become larger problems.
Review the Dashboard with a Decision-Making Cadence
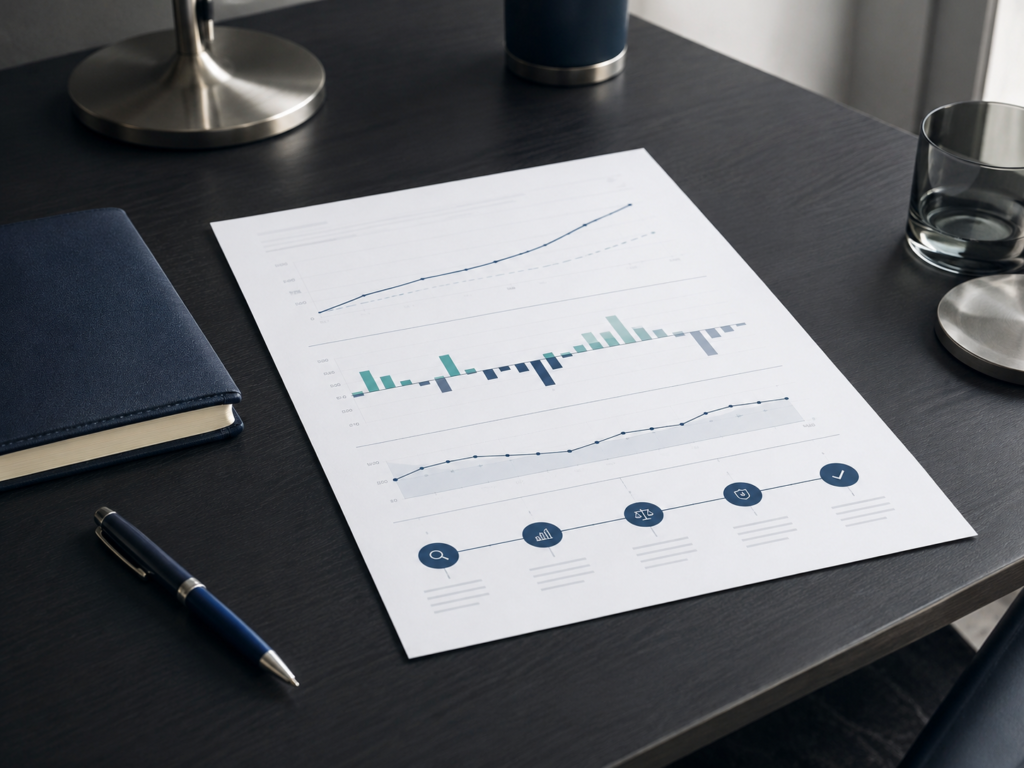
A dashboard only creates value if it is used.
Many companies build dashboards but do not create a consistent rhythm for reviewing them. The dashboard exists, but it does not shape decisions.
A better approach is to connect the dashboard to a regular leadership review.
That review should focus on practical questions:
- What changed this period?
- What is better than expected?
- What is worse than expected?
- Where are we seeing pressure?
- What needs action before the next review?
- What does this mean for cash, margin, hiring, pricing, or growth?
The purpose is not to review every number.
The purpose is to identify what matters and decide what happens next.
This is especially important for growing companies. As activity increases, leadership cannot rely only on instinct or informal updates. A consistent KPI review helps the team stay aligned around the same facts, priorities, and decisions.
Build the Dashboard for the Next Stage
As a business grows, the dashboard should evolve.
The KPIs that matter at one stage may not be enough for the next.
In the early stage, leadership may focus heavily on revenue, cash balance, expenses, and basic profitability. As the company grows, the dashboard may need to include margin by service line, working capital, forecast variance, customer concentration, hiring capacity, utilization, project profitability, or transaction readiness.
This does not mean overbuilding.
A growing company does not need an enterprise-level reporting system before it is ready. But it does need a dashboard that can keep pace with complexity.
The dashboard should help leadership answer today’s questions while preparing for tomorrow’s decisions.
- Can the business support more customers?
- Are margins holding as activity increases?
- Is cash flow strong enough to support hiring?
- Are receivables creating pressure?
- Are systems and processes keeping up with growth?
- Is the company prepared for lender, investor, or buyer conversations?
When the dashboard is built for the stage, the business is entering, it becomes much more useful.
Final Thoughts
KPI dashboards should not be built to impress leadership with more data.
They should be built to help leadership make better decisions.
The strongest dashboards are focused, practical, and connected to the business model. They show what is changing, where attention is needed, and what decisions may need to happen next.
For growing businesses, a dashboard should not become another report that gets reviewed and filed away. It should become part of the management rhythm.
It should help leadership understand performance, protect cash, monitor margins, manage capacity, and plan with more confidence.
At VantageVue, we help businesses strengthen financial visibility through clearer reporting, practical KPI development, forecasting, cash flow visibility, and CFO-level advisory support. Our goal is to help leadership teams move beyond reporting noise and use financial insight to support smarter, more confident business decisions.
To discuss how better KPI dashboards and financial visibility can support your next stage of growth, contact VantageVue Advisory at info@VantageVueAdvisory.com or (612) 200-2651.