Board-ready metrics are auditable, consistent, and decision-oriented. If you need a reconciliation call before your board meeting, your metrics aren’t board-ready.
This guide shows how to build a single flow from GAAP actuals to operating KPIs that your board and team can both trust—without the endless spreadsheet reconciliations.
Who this is for: Founder–CFO teams, controllers, and FP&A leads building consistent, auditable reporting that aligns finance and operations.
KEY TAKEAWAYS
- Board-ready = reconciled, repeatable, and decision-oriented.
- Every KPI should map back to a GAAP source once.
- A shared metric dictionary prevents “spreadsheet drift.”
- Refresh metrics at the same cadence as your financial close.
What “Board-Ready” Really Means (in plain English)
Board-ready metrics are auditable, consistent, and actionable.
They reconcile to GAAP actuals, align with the forecast model, and tell a story leadership can trust. Most finance teams spend more time validating numbers than discussing what they mean. That’s a signal your data flow is broken—not your math.
Pull-quote: “If your board pack and FP&A model disagree, you don’t have a reporting problem—you have a design problem.”
Why Metrics Drift (and How to Stop It)
Metrics drift happens when the same KPI means different things across systems, decks, or months. It starts small—a new tab in a workbook, a renamed column, an updated definition—and multiplies as the company scales.
Symptoms of drift
- CAC, MRR, or Gross Margin vary by deck or owner.
- Net burn in FP&A doesn’t tie to operating cash flow in accounting.
- Board slides depend on 5+ manual exports or ad-hoc joins.
Root causes
- No single metric dictionary or data owner.
- Different refresh cadences between FP&A and accounting.
- Ad-hoc Excel models that live outside source systems.
Fix
Reconcile each KPI once at the GL level, publish a single definition, and feed every report from the same refreshed dataset.
Cue: If you’re verifying the same number twice in two systems, you’re managing drift—not performance.

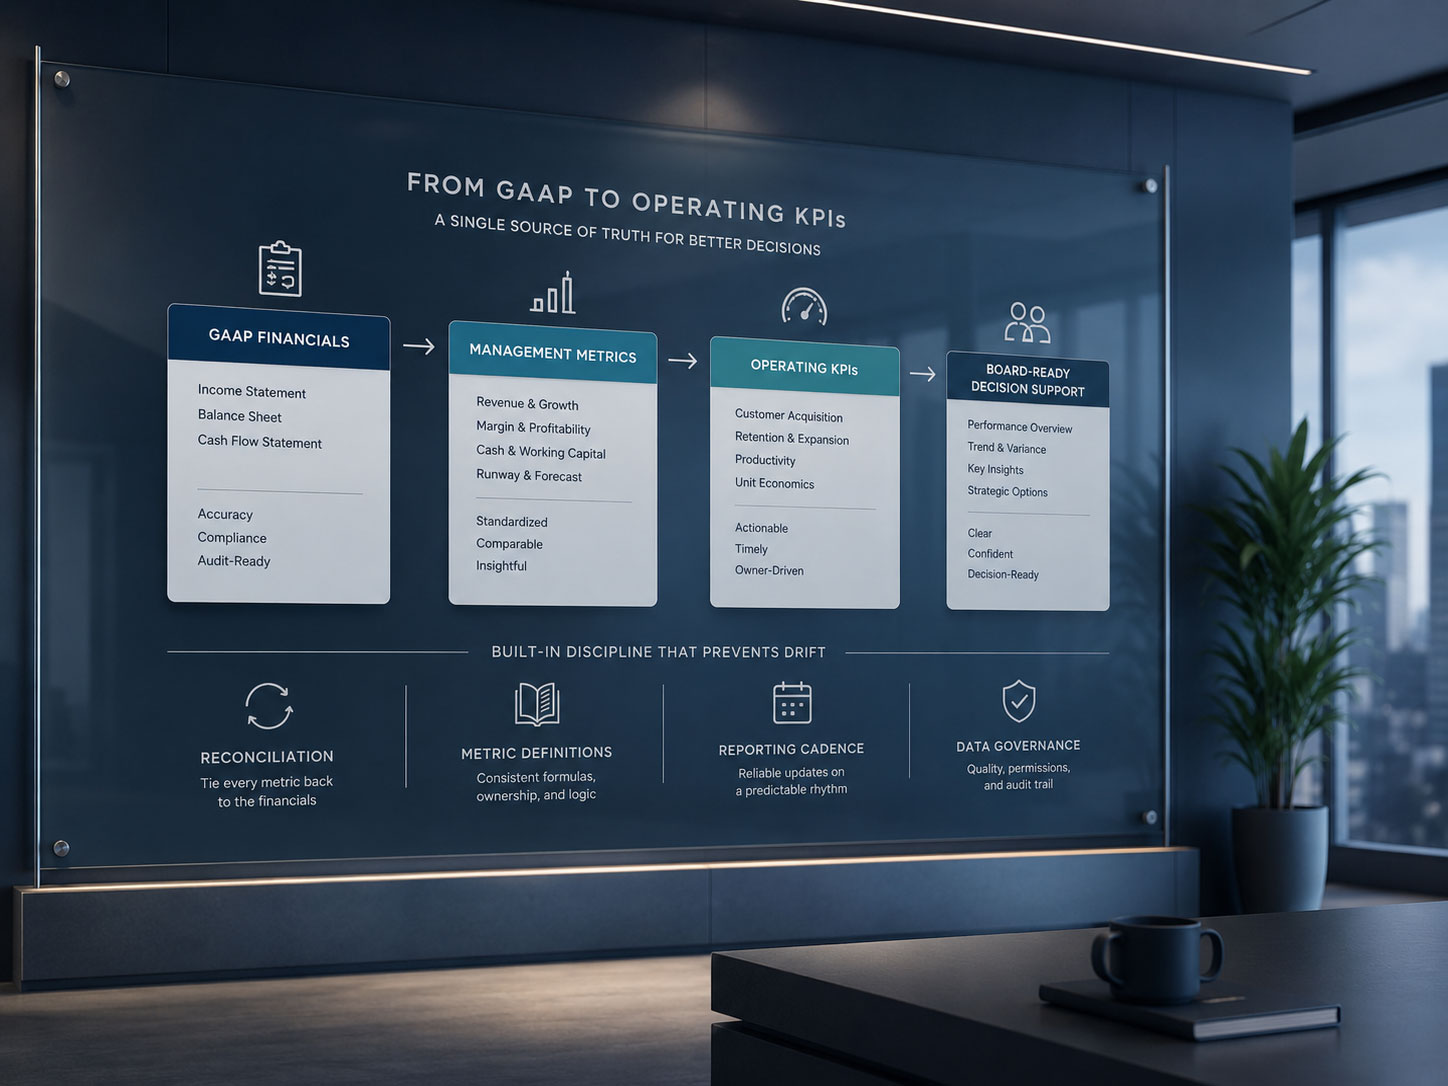
Map the Metric Flow: GAAP → Management → Operating KPIs
Every reliable board pack flows through three data layers:
| Layer | Owner | Purpose | Example Metrics |
| GAAP Actuals | Accounting | Compliance, audit, historical record | Revenue, COGS, Net Income |
| Management Metrics | FP&A | Performance view, scenario baseline | Gross Margin %, OpEx by Function, EBITDA |
| Operating KPIs | Business Leads | Drivers and levers | CAC, LTV, NRR, Pipeline Conversion |
Best practices
- Enforce 1:1 lineage: every KPI traces to a single GAAP source.
- Publish a metric dictionary (definition, source, owner, refresh cadence).
- Use one staging dataset (warehouse view or BI model) to feed FP&A and board packs.Try this: Pick one KPI—say, CAC. Trace it through your FP&A file to the GL accounts it uses. If you can’t follow the trail in two steps or less, you don’t have a reproducible metric.
The Metric Dictionary: Audit Trail for KPIs

Every clean reporting system has a metric dictionary—a shared table defining what each KPI means, where it comes from, who owns it, and how often it’s updated.
Example structure:
| Metric | Definition | Data Source | Owner | Frequency | Reconciled To |
| CAC | Total GTM Spend ÷ New Customers | GL + CRM | FP&A | Monthly | Expense Ledger |
| LTV | ARPU × Gross Margin % × Average Paid Tenure (months) | Billing + Finance Model | FP&A | Quarterly | Revenue Ledger |
| NRR | (Current MRR + Expansion − Churn) ÷ Prior MRR | Billing System | RevOps | Monthly | MRR Report |
How to use it:
- Store this table in the same folder as your forecast model and board pack.
- Version it monthly (e.g., Metrics_Dictionary_2025-10).
- Review any metric definition changes before every quarterly board meeting.The act of maintaining the dictionary is data governance.
Tools & Cadence: Keeping Metrics in Sync
To eliminate spreadsheet drift, align data refresh cadence to your close cadence and make reconciliations routine.
Checklist for metric integrity
- Reconcile actuals → forecast → board pack every close cycle.
- Refresh KPIs at the same time as the accounting close.
- Freeze prior versions—never overwrite live data.
- Maintain a short “Metrics Reconciliation Note” alongside each board deck summarizing definition changes or source updates.Metric Stability = (how often you reconcile × how strictly you version) ÷ how many sources you rely on
Try this: Add a “Metric Health” tab in your forecast model listing each KPI, owner, last update date, and reconciliation status.
From Metrics to Narrative
The end goal of clean metrics is clarity and confidence. When data flows correctly:
- GAAP actuals reconcile to cash.
- KPIs reconcile to GAAP.
- Trends roll forward seamlessly into strategy and board slides.Quick test: If your CEO quotes CAC or Gross Margin from the board deck and your Controller agrees without a footnote, you’re board-ready. Second test: the KPI in the FP&A model shows the same number and the same definition date.
Common Mistakes (and Quick Fixes)
- Shrink the list: keep 10–15 KPIs that explain variance.
- Freeze definitions: version the dictionary; no silent changes.
- Reconcile before visuals: build ties, then slides.
- Centralize joins: replace manual Excel merges with shared views/pipelines.